| Federal Finance Charts: | Expenses/Receipts/Debt as % of GDP | Public Debt, Real Dollars | Funding of Federal Operations | Discretionary Spending |
|---|

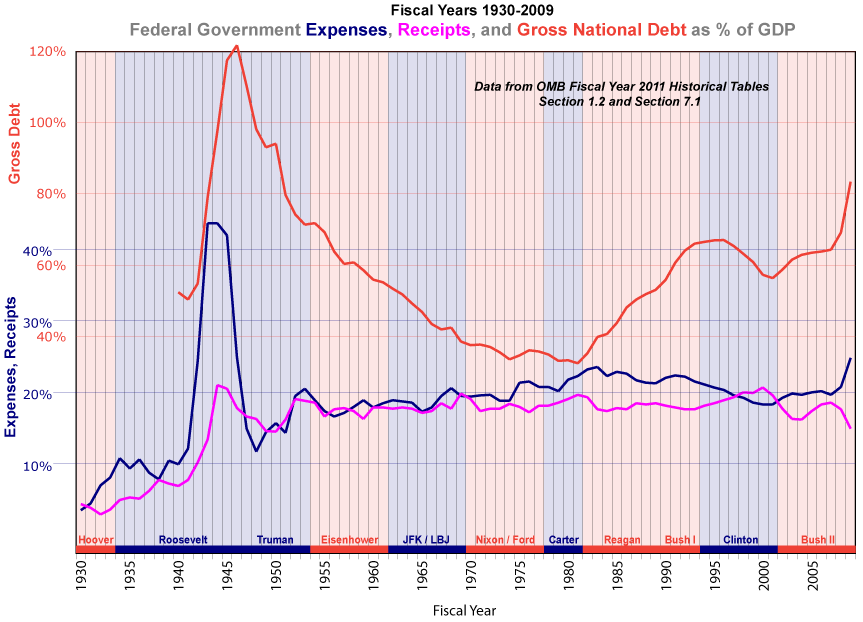
It is clear from this chart that rarely in the past 65 years have total Federal government revenues for any fiscal year exceeded total expenses. And yet the total national debt as a percent of GDP was reduced substantially during the years from 1946 to 1981 and the last five years of the Clinton administration. How is that possible?
The answer is that, in any fiscal year, if the percent change in Federal debt is less than the percent growth in GDP, including inflation, the national debt as a percent of GDP will be reduced.
The chart also shows quite dramatically the failure of “Reaganomics”, also known as “supply-side economics,” commencing in the early 1980s and during the Bush II administration. The thesis was that by cutting taxes and controlling government expenses the size of the federal budget as a percent of the economy could be reduced, the reduced taxes would stimulate business and growth in GDP, and increased revenues resulting from that would permit essential government services to be maintained with lower tax rates. Unfortunately, Federal expenditures, which historically have typically run at a rate of about 20% of GDP (or a little less) actually increased during the Reagan and Bush I administrations, continuing a trend begun during the Nixon administration as a result of the expense of the VietNam war and also at least partially a result of two economic recessions. Combined with the significant decrease in revenues created by the lower income tax rates, this resulted in a ballooning of the Federal debt. That trend was reversed briefly during the Clinton years with slight tax increases and a significant decrease in expenses as percent of GDP as a result of robust economic growth. But a similar effect ensued during the 2000s as a result of the Bush II tax cuts, modest growth in expenditures (back to the 20% level) coupled with slower growth of GDP and culminating in the severe economic recession of fiscal 2009. Note that fiscal year 2009, the last for which actual numbers are available, began on October 1, 2008.
In the past 70 years (1940-2009) the lowest ratio of gross national debt to GDP was 32.5% at the end of fiscal year 1981, the final Carter-administration budget year.