| Federal Finance Charts: | Expenses/Receipts/Debt as % of GDP | Public Debt, Real Dollars | Funding of Federal Operations | Discretionary Spending |
|---|

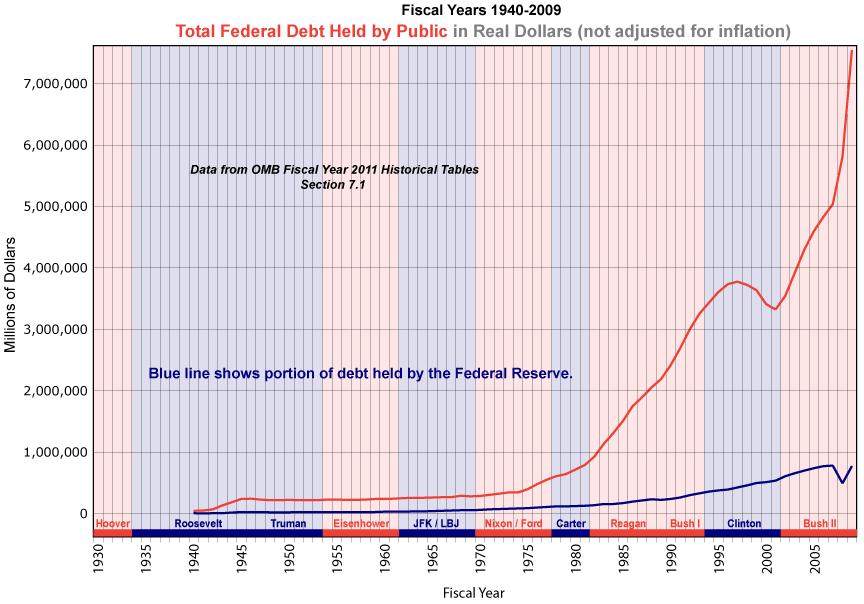
Amazingly, although Federal debt as a percent of GDP declined from 1945 to 1981, the amount of the debt in real dollars never declined by any significant amount during that period. That means the Federal debt from WWII was never paid down. It merely became a revolving line of credit for the Federal government. As GDP increased and the value of the US dollar declined due to inflation, the government increased its credit limit. So, despite increased borrowing during the 1970s (resulting from VietNam war expenses), debt as a percent of GDP reached a low in 1981. The only time since 1940 that the dollar amount owed to the public by the Federal government has actually been paid down by any significant amount was during the final few years of the Clinton administration.
The portion of Federal debt held by the Federal Reserve reflects open market transactions by means of which the Federal Reserve is able to control interest rates and the money supply. When the Federal Reserve buys US Treasury bonds those purchases tend to drive up the value of the bonds, thereby reducing yields for bond traders, and those purchases also have the effect of putting more money, as US dollars, into circulation. (This activity is often referred to as “the Federal Reserve printing money.”)